Thursday, August 27, 2015

Amazon Underground – New Business Model for Android Apps

My friends and family members who build apps tell me that there’s a huge hurdle to cross on the road to monetization. Users are willing and eager to download new games and tools, but can be reluctant to pay to do so and expect a lot for free. While some apps make good use of In-App Purchasing (IAP) as a monetization vehicle and optimize for the (reported) 2% to 10% of the user base, many developers struggle to build an audience and a sustainable business model.

We aim to change things with the new Amazon Underground app for Android phones. This app builds upon the regular Amazon mobile shopping app, providing users with access to over ten thousand dollars in apps, games, and in-app purchases that are actually free. Underground apps and games are also available automatically on Kindle Fire HD and Fire HDX tablets.

As an app developer, you get paid $0.002 (1/5th of a cent) for every minute that a customer is using your Amazon Underground app. You can now focus on building apps that engage your users over the long term. You can build up long-term story lines, roll out additional content over time, and count on a continued revenue stream that is based on actual usage.

To learn more, register for a free developer account, read the eligibility and submission checklist, migrate to Amazon Underground, and submit your app to the Amazon Appstore and read this blog post.

Jeff;

Tuesday, August 25, 2015

Building Price-Aware Applications Using EC2 Spot Instances

Last month I began writing what I hope to be a continuing series of posts of EC2 Spot Instances by talking about some Spot Instance Best Practices. Today I spoke to two senior members of the EC2 Spot Team to learn how to build price-aware applications using Spot Instances. I met with Dmitry Pushkarev (Head of Tech Development) and Joshua Burgin (General Manager) and would like to recap our conversation in interview form!

Me: What does price really mean in the Spot world?

Joshua: Price and price history are important considerations when building Spot applications. Using price as a signal about availability helps our customers to deploy applications in the most available capacity pools, reduces the chance of interruption and improves the overall price-performance of the application.

Prices for instances on the Spot Market are determined by supply and demand. A low price means that there is a more capacity in the pool than demand. Consistently low prices and low price variance means that pool is consistently underutilized. This is often the case for older generations of instances such as m1.small, c1.xlarge, and cc2.8xlarge.


Me: How do our customers build applications that are at home in this environment?

Dmitry: It is important to architect your application for fault tolerance and to make use of historical price information. There are probably as many placement strategies as there are customers, but generally we see two very successful use patterns: one is choosing capacity pools (instance type and availability zone) with low price variance and the other is to distribute capacity across multiple capacity pools.

There is a good analogy with the stock market – you can either search for a “best performing” capacity pool and periodically revisit your choice or to diversify your capacity across multiple uncorrelated pools and greatly reduce your exposure to risk of interruption.


Me: Tell me a bit more about these placement strategies.

Joshua: The idea here is to analyze the recent Spot price history in order to find pools with consistently low price variance. One way to do this is by ordering capacity pools by duration of time that elapsed since the last time Spot price exceeded your preferred bid – which is the maximum amount you’re willing to pay per hour. Even though past performance certainly doesn’t guarantee future results it is a good starting point. This strategy can be used to make bids on instances that can be used for dev environments and long running analysis jobs. It is also good for adding supplemental capacity to Amazon EMR clusters. We also recommend that our customers revisit their choices over time in order to ensure that they continue to use the pools that provide them with the most benefit.

Me: How can our customers access this price history?

Dmitry: It’s available through the console as well as programmatically through SDKs and the AWS Command Line Interface (CLI).

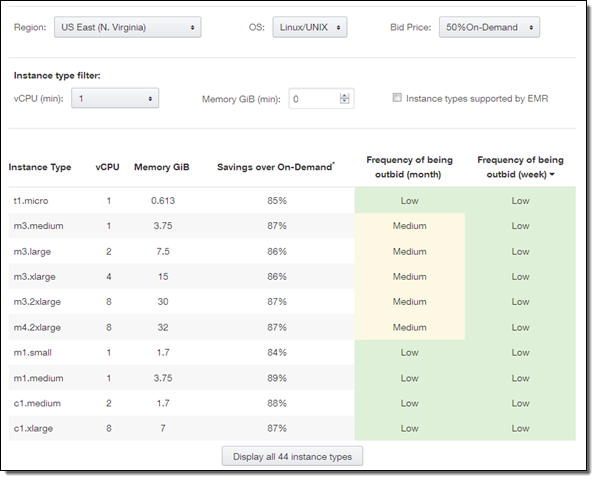
We’ve also created a new web-based Spot Bid Advisor that can be accessed from the Spot page. This tool presents the relevant statistics averaged across multiple availability zones making it easy to find instance types with low price volatility. You can choose the region, operating system, and bid price (25%, 50%, or 100% of On-Demand) and then view historical frequency of being outbid for last week or a month.

Another example can be found in the aws-spot-labs repo on GitHub. The get_spot_duration.py script demonstrates how spot price information can be obtained programmatically and used to order instance types and availability zones based on the duration since the price last exceeded your preferred bid price.


Me: Ok, and then I pick one of the top instance pools and periodically revisit my choice?

Dmitry: Yes, that’s a great way to get started. As you get more comfortable with Spot typically next step is to start using multiple pools at the same time and distribute capacity equally among them. Because capacity pools are physically separate, prices often do not correlate among them, and it’s very rare that more than one capacity pool will experience a price increase within a short period of time.

This will reduce the impact of interruptions and give you plenty of time to restore the desired level of capacity.

Joshua: Distributing capacity this way also improves long-term price/performance: if capacity is distributed evenly across multiple instance types and/or availability zones then the hourly price is averaged across multiple pools which results in really good overall price performance.


Me: Ok, sounds great. Now let’s talk about the second step, bidding strategies.

Joshua: It is important to place a reasonable bid at a price that you are willing to pay. It’s better to achieve higher availability by carefully selecting multiple capacity pools and distributing your application across the instances therein than by placing unreasonably high spot bids. When you see increasing prices within a capacity pool, this is a sign that demand is increasing. You should start migrating your workload to less expensive pools or shut down idle instances with high prices in order to avoid getting interrupted.

Me: Do you often see our customers use more sophisticated bidding tactics?

Dmitry: For many of our customers the ability to leverage Spot is an important competitive advantage and some of them run their entire production stacks on it – which certainly requires additional engineering to hit their SLA. One interesting way to think about Spot is to view is it as a significant reward for engineering applications that are “cloud friendly.” By that I mean fault tolerant by design, flexible, and price aware. Being price aware allows the application to deploy itself to the pools with the most spare capacity available. Startups in particular often get very creative with how they use Spot which allows them to scale faster and spend less on compute infrastructure.

Joshua: Tools like Auto Scaling, Spot fleet, and Elastic MapReduce offer Spot integration and allow our customers to use multiple capacity pools simultaneously without adding significant development effort.


Stay tuned for even more information about Spot Instances! In the meantime, please feel free to leave your own tips (and questions) in the comments.

Jeff;

Monday, August 24, 2015

AWS Week in Review – August 17, 2015

Let’s take a quick look at what happened in AWS-land last week:

Monday, August 17
Tuesday, August 18
Wednesday, August 19
Thursday, August 20
Friday, August 21

New & Notable Open Source

  • jungle simplifies AWS command line operations.
  • Trycorder is a cross-account AWS data collector.
  • cep implements Complex Event Processing using DynamoDB Streams and Lambda.
  • glambda is a module for mocking and testing AWS API Gateway in conjunction with Lambda functions.
  • puppetlabs-aws is a Puppet module for managing AWS resources to build out infrastructure.
  • kinesis-tail is “tail -f” for Kinesis streams.
  • let-me-in adds an IP address to a Security Group to allow instance access via SSH.
  • connection-tracker tracks public endpoints and connections across AWS accounts using VPC Flow Logs.
  • aws-gpg13 is a collection of tests and CloudFormation templates to assess GPG13 compliance.
  • aws-sandbox defines an AWS sandbox infrastructure with Terraform.io.
  • eclair is a simple SSH tool for EC2.
  • dnachat is a lightweight chat server that runs on EC2 and uses ElastiCache for Redis.

New Customer Stories

  • BQool – Review and feedback management for Amazon sellers.
  • GULP – Human resources portal.
  • ITV – Test and production environments for UK commercial television.
  • Kit Check – IoT-driven medication tracking for hospitals.
  • Makewaves – Social badging platform.
  • Myriad Group – New social networking system + legacy system migration.
  • SIGMA SPORT – SaaS for athletic training data.
  • ThinPrint – Global printing platform.
  • Tullius Walden – Cloud-based German bank.

New YouTube Videos

New SlideShare Content

New Marketplace Applications

Upcoming Events

Upcoming Events at the AWS Loft (San Francisco)

Upcoming Events at the AWS Loft (New York)

Help Wanted

Stay tuned for next week! In the meantime, follow me on Twitter and subscribe to the RSS feed.

Jeff;

Friday, August 21, 2015

New – Store and Process Graph Data using the DynamoDB Storage Backend for Titan

Graph databases elegantly and efficiently represent entities (generally known as vertices or nodes) and relationships (edges) that connect them. Here’s a very simple example of a graph:

Bill and Candace have a daughter named Janet, and she has a son named Bob. This makes Candace Bob’s grandmother, and Bill his grandfather.

Once a graph has been built, it is processed by traversing the edges between the vertices. In the graph above, we could traverse from Bill to Janet, and from there to Bob. Graphs can be used to model social networks (friends and “likes”), business relationships (companies, employees, partners, suppliers, and customers), dependencies, and so forth. Both vertices and edges can be typed; some vertices could be people as in our example, and others places. Similarly some edges could denote (as above) familial relationships and others could denote “likes.” Every graph database allows additional information to be attached to each vertex and to each edge, often in the form of name-value pairs.

Titan is a scalable graph database that is optimized for storing and querying graphs that contain hundreds of billions of vertices and edges. It is transactional, and can support concurrent access from thousands of users.

DynamoDB Storage Backend for Titan
Titan’s pluggable data storage layer already supports several NoSQL databases and key-value stores. This allows you to choose the backend that provides the performance and features required by your application, while giving you the freedom to switch from one backend to another with minimal changes to your application code.

Today we are making a new DynamoDB Storage Backend for Titan available. Storing your Titan graphs in Amazon DynamoDB lets you scale to handle huge graphs without having to worry about building, running, or maintaining your own database cluster. Because DynamoDB can scale to any size and provides high data availability and predictable performance, you can focus on your application instead of on your graph storage and processing infrastructure. You can also run Titan and DynamoDB Local on your laptop for development and testing.

The backend works with versions 0.4.4 and 0.5.4 of Titan. Both versions support fast traversals, edges that are both directed and typed, and stored relationships. The newer version adds support for vertex partitioning, vertex labels, and user defined transaction logs. The backend is client-based; we did not make any changes to DynamoDB to support it. You are simply using DynamoDB as an efficient way to store your Titan graphs.

Version 0.4.4 of Titan is compatible with version 2.4 of the Tinkerpop stack; version 0.5.4 of Titan is compatible with version 2.5 of the stack. Tinkerpop is a collection of tools and algorithms that provides you with even more in the way of graph processing and analysis options.

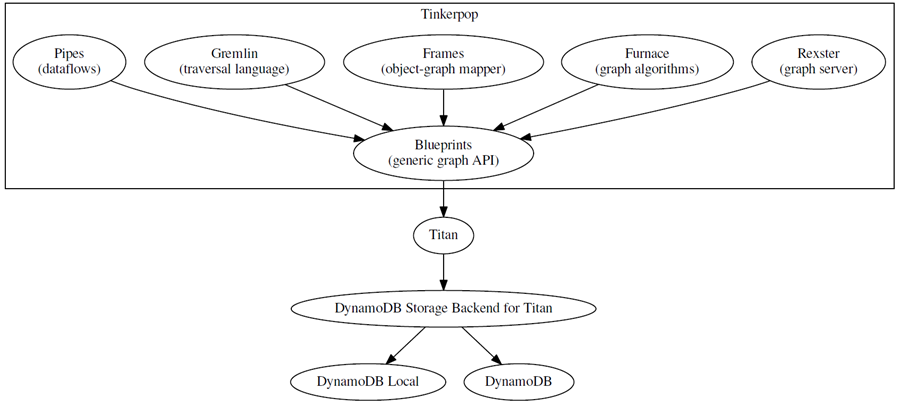
Since I am talking about graphs, I should illustrate all of the items that I have talked about in the form of a graph! Here you go:

My colleague Alex Patrikalakis created the following Gremlin script. It replicates the graph above using Titan and DynamoDB:

conf = new BaseConfiguration()
conf.setProperty("storage.backend", "com.amazon.titan.diskstorage.dynamodb.DynamoDBStoreManager")
conf.setProperty("storage.dynamodb.client.endpoint", "http://localhost:4567")
g = TitanFactory.open(conf)
titan = g.addVertex(null, [name:"Titan"])
blueprints = g.addVertex(null, [name:"Blueprints"])
pipes = g.addVertex(null, [name:"Pipes"])
gremlin = g.addVertex(null, [name:"Gremlin"])
frames = g.addVertex(null, [name:"Frames"])
furnace = g.addVertex(null, [name:"Furnace"])
rexster = g.addVertex(null, [name:"Rexster"])
DynamoDBStorageBackend = g.addVertex(null, [name:"DynamoDB Storage Backend for Titan"])
DynamoDBLocal = g.addVertex(null, [name:"DynamoDB Local"])
DynamoDB = g.addVertex(null, [name:"DynamoDB"])
g.addEdge(titan, blueprints, "implements")
g.addEdge(pipes, blueprints, "builds-on")
g.addEdge(gremlin, blueprints, "builds-on")
g.addEdge(frames, blueprints, "builds-on")
g.addEdge(furnace, blueprints, "builds-on")
g.addEdge(rexster, blueprints, "builds-on")
g.addEdge(titan, DynamoDBStorageBackend, "backed-by")
g.addEdge(DynamoDBStorageBackend, DynamoDBLocal, "connects-to")
g.addEdge(DynamoDBStorageBackend, DynamoDB, "connects-to")
g.commit()

Getting Started
The DynamoDB Storage Backend for Titan is available as a Maven project on GitHub. It runs on Windows, OSX, and Linux and requires Maven and Java 1.7 (or later). The Amazon DynamoDB Storage Backend for Titan includes installation instructions and an example that makes creative use of the Marvel Universe Social Graph public dataset. We have also created a CloudFormation template that will launch an EC2 instance that has the Titan/Rexster stack and the DynamoDB Storage Backend for Titan installed and ready to use.

Jeff;

Titan Graph Database Integration with DynamoDB: World-class Performance, Availability, and Scale for New Workloads

Today, we are releasing a plugin that allows customers to use the Titan graph engine with Amazon DynamoDB as the backend storage layer. It opens up the possibility to enjoy the value that graph databases bring to relationship-centric use cases, without worrying about managing the underlying storage.

The importance of relationships

Relationships are a fundamental aspect of both the physical and virtual worlds. Modern applications need to quickly navigate connections in the physical world of people, cities, and public transit stations as well as the virtual world of search terms, social posts, and genetic code, for example. Developers need efficient methods to store, traverse, and query these relationships. Social media apps navigate relationships between friends, photos, videos, pages, and followers. In supply chain management, connections between airports, warehouses, and retail aisles are critical for cost and time optimization. Similarly, relationships are essential in many other use cases such as financial modeling, risk analysis, genome research, search, gaming, and others. Traditionally, these connections have been stored in relational databases, with each object type requiring its own table. When using relational databases, traversing relationships requires expensive table JOIN operations, causing significantly increased latency as table size and query complexity grow.

Enter graph databases

Graph databases belong to the NoSQL family, and are optimized for storing and traversing relationships. A graph consists of vertices, edges, and associated properties. Each vertex contains a list of properties and edges, which represent the relationships to other vertices. This structure is optimized for fast relationship query and traversal, without requiring expensive table JOIN operations.

In this way, graphs can scale to billions of vertices and edges, while allowing efficient queries and traversal of any subset of the graph with consistent low latency that doesn’t grow proportionally to the overall graph size. This is an important benefit for many use cases that involve accessing and traversing small subsets of a large graph. A concrete example is generating a product recommendation based on purchase interests of a user’s friends, where the relevant social connections are a small subset of the total network. Another example is for tracking inventory in a vast logistics system, where only a subset of its locations is relevant for a specific item. For us at Amazon, the challenge of tracking inventory at massive scale is not just theoretical, but very real.

Graph databases at Amazon

Like many AWS innovations, the desire to build a solution for a scalable graph database came from Amazon’s retail business. Amazon runs one of the largest fulfillment networks in the world, and we need to optimize our systems to quickly and accurately track the movement of vast amounts of inventory. This requires a database that can quickly traverse the logistics history for a given item or order. Graph databases are ideal for the task, since they make it easy to store and retrieve each item’s logistics history.

Our criteria for choosing the right graph engine were:

  1. The ability to support a graph containing billions of vertices and edges.
  2. The ability to scale with the accelerating pace of new items added to the catalog, and new objects and locations in the company’s expanding fulfillment network.

After evaluating different technologies, we decided to use Titan, a distributed graph database engine optimized for creating and querying large graphs. Titan has a pluggable storage architecture, using existing NoSQL databases as underlying storage for the graph data. While the Titan-based solution worked well for our needs, the team quickly found itself having to devote an increasing amount of time to provisioning, managing, and scaling the database cluster behind Titan, instead of focusing on their original task of optimizing the fulfillment inventory tracking.

Thus, the idea was born for a robust, highly available, and scalable backend solution that wouldn’t require the burden of managing a massive storage layer. As I wrote in the past, I believe DynamoDB is a natural choice for such needs, providing developers flexibility and minimal operational overhead without compromising scale, availability, durability, or performance. Making use of Titan’s flexible architecture, we created a plugin that uses DynamoDB as the storage backend for Titan. The combination of Titan with DynamoDB is now powering Amazon’s fulfillment network, with a multi-terabyte dataset.

Sharing it with you

Today, we are happy to bring the result of this effort to customers by releasing the DynamoDB Storage Backend for Titan plugin on GitHub. The plugin provides a flexible data model for each Titan backend table, allowing developers to optimize for simplicity (single-item model) or scalability (multi-item model).

The single-item model uses a single DynamoDB item to store edges and properties of a vertex. In DynamoDB, the vertex ID is stored as the hash key of an item, vertex property and edge identifiers are attribute names, and the vertex property values and edge property values are stored in the respective attribute values. While the single-item data model is simpler, due to DynamoDB’s 400 KB item size limit, you should only use it for graphs with fairly low vertex degree and small number properties per vertex.

For graphs with higher vertex degrees, the multi-item model uses multiple DynamoDB items to store properties and edges of a single vertex. In the multiple-item data model, the vertex ID remains the DynamoDB hash key, but unlike the single-item model, each column becomes the range key in its own item. Each column value is stored in its own attribute. While requiring more writes to initially load the graph, the multiple-item model allows you to store large graphs without limiting vertex degree.

Amazon’s need for a hassle-free, scalable Titan solution is not unique. Many of our customers told us they have used Titan as a scalable graph solution, but setting up and managing the underlying storage are time-consuming chores. Several of them participated in a preview program for the plugin and are excited to offload their graph storage management to AWS. Brian Sweatt, Technical Advisor at AdAgility, explained:

“At AdAgility, we store data pertaining to advertisers and publishers, as well as transactional data about customers who view and interact with our offers. The relationships between these stakeholders lend themselves naturally to a graph database, and we plan to leverage our experience with Titan and Groovy for our next-generation ad targeting platform. Amazon's integration between Titan and DynamoDB will allow us to do that without spending time on setting up and managing the storage cluster, a no brainer for an agile, fast-growing startup.”

Another customer says that AWS makes it easier to analyze large graphs of data and relationships within the data. According to Tom Soderstrom, Chief Technology Officer at NASA’s Jet Propulsion Laboratory:

“We have begun to leverage graph databases extensively at JPL and running deep machine learning on these. The open sourced plugin for Titan over DynamoDB will help us expand our use cases to larger data sets, while enjoying the power of cloud computing in a fully managed NoSQL database. It is exciting to see AWS integrate DynamoDB with open sourced projects like Elasticsearch and Titan, while open sourcing the integrations.”

Bringing it all together

When building applications that are centered on relationships (such as social networks or master data management) or auxiliary relationship-focused use cases for existing applications (such as a recommendation engine for matching players in a game or fraud detection for a payment system), a graph database is an intuitive and effective way to achieve fast performance at scale, and should be on your database options shortlist. With this launch of the DynamoDB storage backend for Titan, you no longer need to worry about managing the storage layer for your Titan graphs, making it easy to manage even very large graphs like the ones we have here at Amazon. I am excited to hear how you are leveraging graph databases for your applications. Please share your thoughts in the comment section below.

For more information about the DynamoDB storage backend plug-in for Titan, see Jeff Barr’s blog and the Amazon DynamoDB Storage Backend for Titan topic in the Amazon DynamoDB Developer Guide

Thursday, August 20, 2015

New APN Competency – Mobile

My doctor, my dentist, and my car mechanic each display their diplomas, licenses, and certifications in prominent locations within their offices. These documents reassure me (and prospective patients or customers) that the owners take their professions seriously, that they have invested time in their education, and that they have demonstrated their competency to the appropriate licensing board or agency.

The APN Competencies are similar. They indicate that a member of the AWS Partner Network (APN) has demonstrated their hard-won expertise and proven success in specialized solution areas. After a partner has demonstrated their expertise to us, they are eligible to join the APN and to list their competencies in their marketing materials. In the past year we have announced the following new competencies:

  • Security
  • Marketing and Commerce
  • Healthcare
  • Digital Media
  • Storage
  • Life Sciences

New Mobile Competency
The new APN Mobile Competency recognizes partners that have deep experience with mobile-first development. They help their customers to build, test, analyze, and monitor their AWS-powered mobile apps.

Congratulations are due to our launch partners:

Developer Tools & Components – These partners accelerate project creation with tools and components to assist with each lifecycle stage of software development. Launch partners are Kony Solutions, Twilio, SecureAuth, Xamarin, and Auth0.

Testing & Performance Management – These partners facilitate application testing and monitoring, and get insights into the stability and integrity of the application and its architecture. Our launch partner is Crittercism.

Analytics & User Engagement – These partners strive to understand user activity, anticipate future behaviors, and increase user engagement. Our launch partners are Taplytics, Tableau, and Looker.

App Development & Consulting – These partners provide assistance with application development, help to validate best practices, and conduct analysis on architecture and implementation decisions. Our launch partners are Accenture, Slalom Consulting, Classmethod, Concrete Solutions, Mobiquity, and NorthBay Solutions.

Ready to Assist You
All of the partners listed above are ready to assist you with your mobile development needs and are equipped to support you. Visit our new Mobile Partner Solutions page to learn more!

Jeff;

Tuesday, August 18, 2015

New Metrics for EC2 Container Service: Clusters & Services

The Amazon EC2 Container Service helps you to build, run, and scale Docker-based applications. As I noted in an earlier post (EC2 Container Service – Latest Features, Customer Successes, and More), you will benefit from easy cluster management, high performance, flexible scheduling, extensibility, portability, and AWS integration while running in an AWS-powered environment that is secure and efficient.

Container-based applications are built from tasks. A task is one or more Docker containers that run together on the same EC2 instance; instances are grouped in to a cluster. The instances form a pool of resources that can be used to run tasks.

This model creates some new measuring and monitoring challenges. In order to keep the cluster at an appropriate size (not too big and not too small), you need to watch memory and CPU utilization for the entire cluster rather than for individual instances. This becomes even more challenging when a single cluster contains EC2 instances with varied amounts of compute power and memory.

New Cluster Metrics
In order to allow you to properly measure, monitor, and scale your clusters, we are introducing new metrics that are collected from individual instances, normalized based on the instance size and the container configuration, and then reported to Amazon CloudWatch. You can observe the metrics in the AWS Management Console and you can use them to drive Auto Scaling activities.

The ECS Container Agent runs on each of the instances. It collects the CPU and memory metrics at the instance and task level, and sends them to a telemetry service for normalization. The normalization process creates blended metrics that represent CPU and memory usage for the entire cluster. These metrics give you a picture of overall cluster utilization.

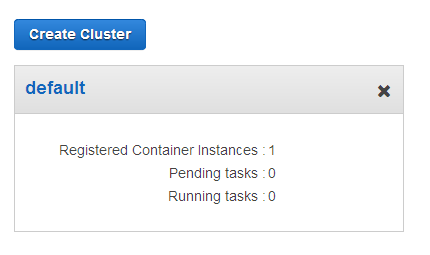
Let’s take a look! My cluster is named default and it has one t2.medium instance:

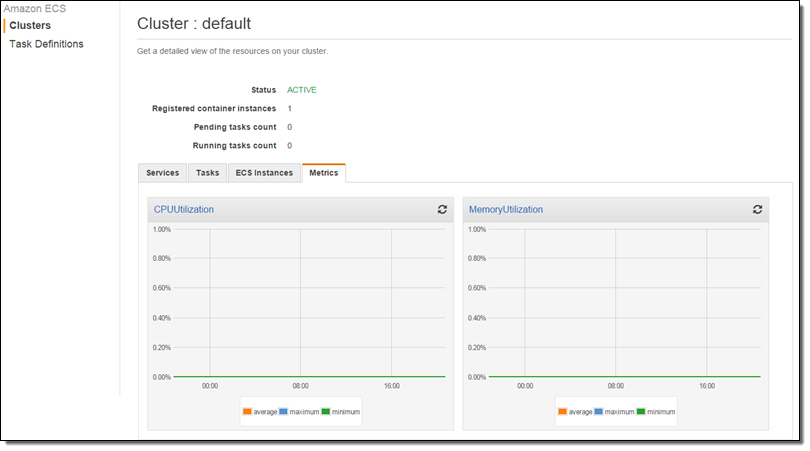
At this point no tasks are running and the cluster is idle:

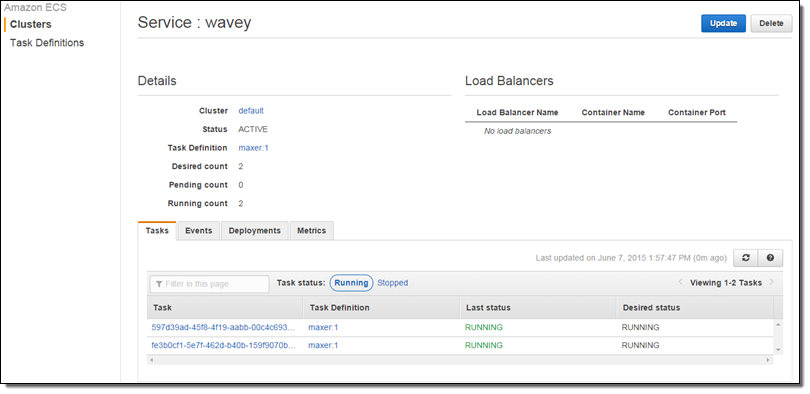
I ran two tasks (as a service) with the expectation that they will consume all of the CPU:

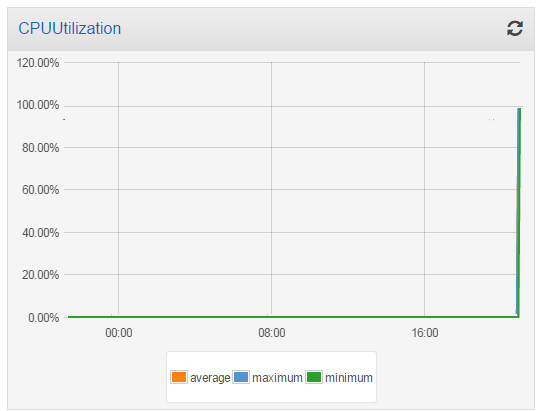
I took a short break to water my garden while the task burned some CPU and the metrics accumulated! I came back and here’s what the CPU Utilization looked like:

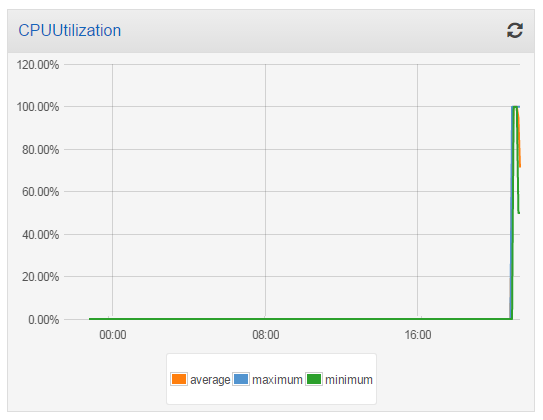
Then I launched another t2.medium instance into my cluster, and checked the utilization again. The additional processing power reduced the overall utilization to 50%:

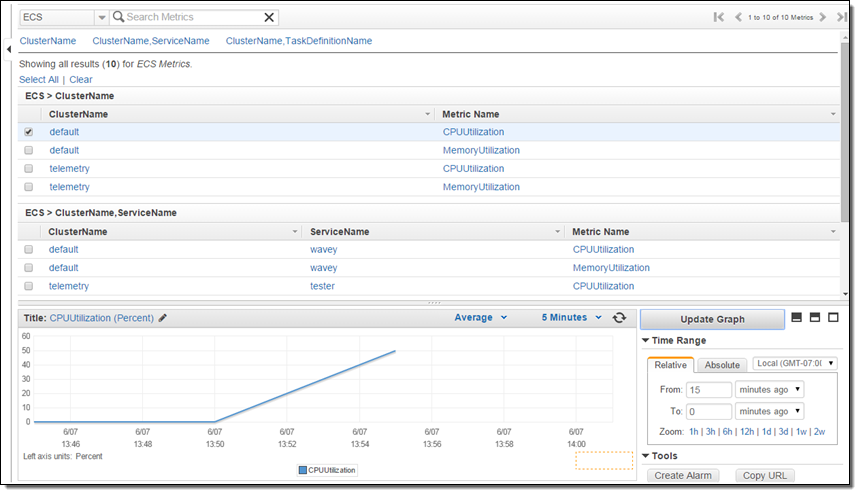
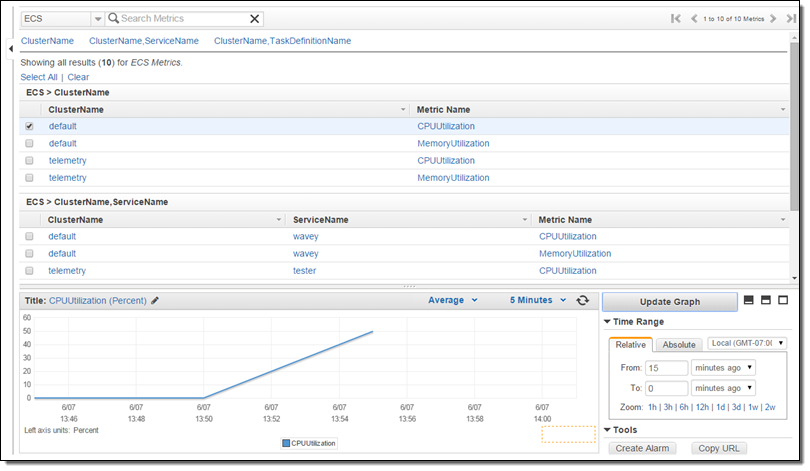
The new metrics (CPUUtilization and MemoryUtilization) are available via CloudWatch and can also be used to create alarms. Here’s how to find them:

New Service Metrics
Earlier this year we announced that the EC2 Container Service supports long-running applications and load balancing. The Service scheduler allows you to manage long-running applications and services by keeping them healthy and scaled to the desired level. CPU and memory utilization metrics are now collected and processed on a per-service basis, and are visible in the Console:

The new cluster and server metrics are available now and you can start using them today!

Jeff;

Wednesday, August 12, 2015

New – Monitor Your AWS Free Tier Usage

I strongly believe that you need to make a continuous investment in learning about new tools and technologies that will enhance your career. When I began my career in the software industry, the release cycles for hardware and software were measured in months, quarters, or years. Back then (the 1980’s, to be precise) you could spend some time learning about a new language, database, or operating system and then make use of that knowledge for quite some time. Today, the situation is different. Not only has the pace of innovation increased, but the model has changed. In the old days, physical distribution via tapes, floppy disks, or CDs ruled the day. The need to produce and ship these items in volume led to a model where long periods of stasis were punctuated by short, infrequent bursts of change.

Today’s cloud-based distribution model means that new features can be deployed and made available to you in days. Punctuated equilibrium (to borrow a term from evolutionary biology) has given way to gradualism. Systems become a little bit better every day, sometimes in incremental steps that can mask major changes if you are not paying attention. If you are a regular reader of this blog, you probably have a good sense for the pace of AWS innovation. We add incremental features almost every day (see the AWS What’s New for more info), and we take bigger leaps into the future just about every month. If you want to stay at the top of your game, you should plan to spend some time using these new features and gaining direct, personal experience with them.

Use the Free Tier
The AWS Free Tier should help you in this regard. You can create and use EC2 instances, EBS volumes, S3 storage, DynamoDB tables, Lambda functions, RDS databases, transcoding, messaging, load balancing, caching, and much more. Some of these benefits are available to you for 12 months after you sign up for a free AWS account; others are available to you regardless of the age of your account. You can use these AWS resources to build and host a static website, deploy a web app (on Linux or Node.js), host a .NET application, learn about the AWS APIs via our AWS SDKs, create interesting demos, and explore our newest services. If you are new to AWS, our Getting Started with AWS page should point you in the right direction.

New Free Tier Monitoring
You receive a fairly generous allowance of AWS resources as part of the Free Tier (enough to host and run a website for a year with enough left over for additional experimentation); you will not be billed unless your usage exceeds those allowances.

Today we are adding a new feature that will allow you to keep better track of your AWS usage and to see where you are with respect to the Free Tier allowances for each service. You can easily view your actual usage (month to date) and your forecasted usage (up to the end of the month) for the services that you are using that are eligible for the Free Tier. This feature applies to the offerings that are made available to you during the first year of AWS usage, and will be visible to you only if your account is less than one year old.

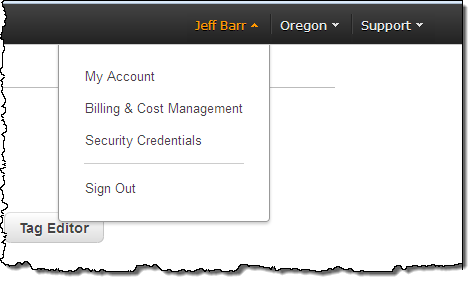
You can also see your consumption on a percentage basis. All of this information is available to you in the Billing and Cost Management Dashboard. Simply click on your name in the Console’s menu bar, choose Billing and Cost Management:

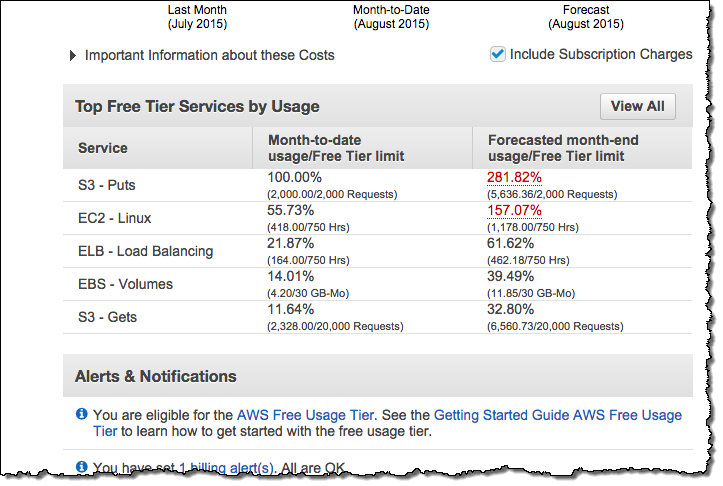
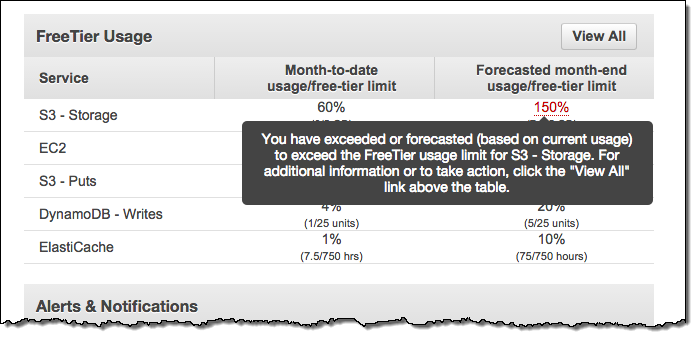
You will see your Free Tier usage for the top 5 services:

You can hover your mouse over any of the values to learn more via a tooltip:

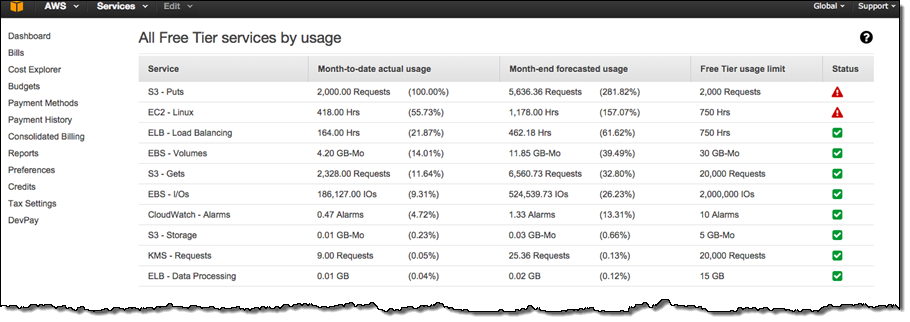
You can also see your usage across all services by clicking on View All:

You can also get tooltips for the items on this page.

Using the Information
You can look at and interpret this page in two ways. If you must stay within the Free Tier for budgetary reasons, you can use it to restrain your enthusiasm. If you are interested in getting as much value as you can from the Free Tier and learning as much as possible, you can spend some time looking for services that you have not yet used, and focus your efforts there. If the last screen shot above represented your actual account, you might want to dive in to AWS Lambda to learn more about server-less computing!

Getting Started with AWS
I sometimes meet with developers who have read about AWS and cloud computing, but who have yet to experience it first-hand. There’s a general sense that cloud computing is nothing more than a different form or hosting or colocation, and that they can simply learn on the job when it is time for them to move their career forward. That might be true, but I am confident that they’ll be in a far better position to progress in their career if they proactively decide to learn about and gain hands on experience now. Reading about how you can create a server or a database in minutes is one thing, doing it for yourself (and seeing just how quick and easy it is) is another. If you are ready, I would encourage you to sign up for AWS, read our getting started with AWS tutorials, watch some our instructional videos, and consider our self-paced hands-on labs.

Available Now
This information is available now in all public AWS Regions!

Jeff;

Tuesday, August 11, 2015

Elastic Beanstalk Update – Enhanced Application Health Monitoring

My colleague Abhishek Singh shared a guest post that brings word of a helpful new Elastic Beanstalk feature!

— Jeff;


AWS Elastic Beanstalk simplifies the process of deploying and scaling Java, .NET, PHP, Node.js, Python, Ruby, Go, and Docker web applications and services on AWS. Today we are making Elastic Beanstalk even more useful by adding support for enhanced application health monitoring.

To understand the benefit of this new feature, imagine you have a web application with a bug that causes it to return an error when someone visits the /blog page but the rest of your application works as expected. Previously, you could detect such issues by either monitoring the Elastic Load Balancers HTTPCode_Backend_5XX metric or going to the URL yourself to test it out. With enhanced application health monitoring, Elastic Beanstalk does the monitoring for you and highlights such issues by changing the health status as necessary. With this new feature, Elastic Beanstalk not only monitors the EC2 and ELB health check statuses but also monitors processes (application, proxy, etc.) and essential metrics (CPU, memory, disk space, etc.) to determine the overall health of your application.

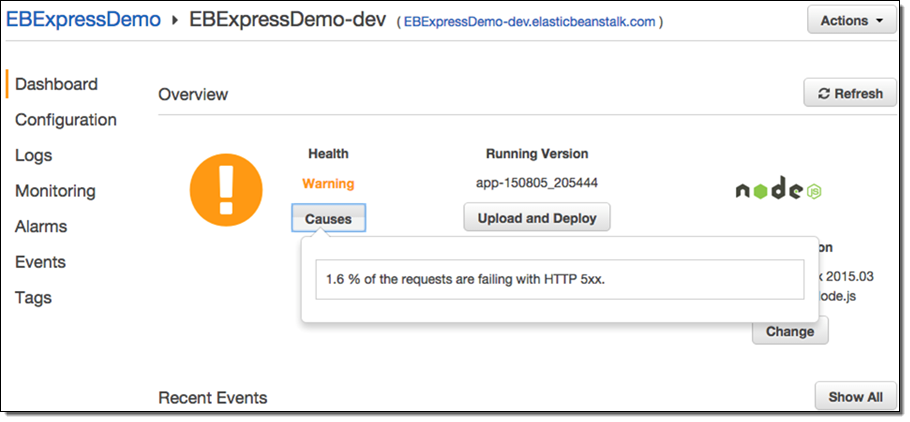
At the core of the enhanced health monitoring feature are a set of rules that allow Elastic Beanstalk to detect anomalies in your running application and flag them by changing the health status. With every change in health status, Elastic Beanstalk provides a list of causes for the change. In the example above, the system would detect an increase in 500 errors as visitors visit the /blog page and flag it by changing the health status from “Ok” to “Warning” with a cause of “More than 1% of requests are failing with 5XX errors”.

Here’s what the status looks like in the AWS Management Console:

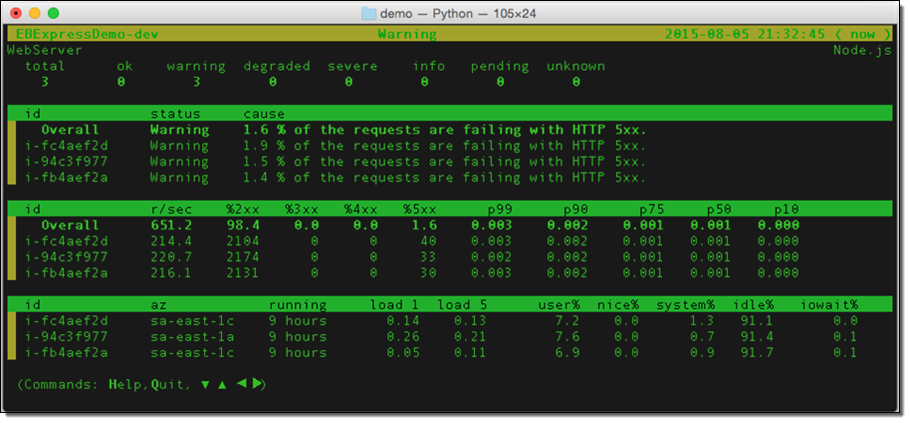
And from the command line (via eb health --refresh):

As you can see, this makes it much easier to know when your application is not performing as expected, and why this is the case (we are working on a similar view for the Console). For further details on how enhanced application health monitoring works, see Factors in Determining Instance and Environment Health.

As part of this feature we have also made some other changes:

  • Health monitoring is now near real-time. Elastic Beanstalk now evaluates application health and reports metrics every 10 seconds or so instead of every minute.
  • Rolling deployments require health checks to pass before a version deployment to a batch of instances is deemed successful. This ensures that any impact due to regressions in application versions is minimized to a batch of instances. For more information, see Deploying Application Versions in Batches.
  • The set of values for the health status has been expanded from three (Green, Yellow, and Red) to seven (Ok, Warning, Degraded, Severe, Info, Pending, and Unknown). This allows Elastic Beanstalk to provide you with a more meaningful health status. For more information, see Health Colors and Statuses.
  • We have added over 40 additional environment and instance metrics including percentiles of application response times, hard disk space consumption, CPU utilization, all of which can be published to Amazon CloudWatch as desired for monitoring and alarming. For a complete list of available metrics and more information on how to use Amazon CloudWatch with this feature, see Enhanced Health Metrics.

To begin using this feature, log in to the AWS Elastic Beanstalk Management Console or use the EB CLI to create an environment running platform version 2.0.0 or newer.

Abhishek Singh, Senior Product Manager, AWS Elastic Beanstalk