You have had the power to store your own business, application, and system metrics in Amazon CloudWatch for quite some time (see New – Custom Metrics for Amazon CloudWatch to learn more). As I wrote way back in 2011 when I introduced this feature, “You can view graphs, set alarms, and initiate automated actions based on these metrics, just as you can for the metrics that CloudWatch already stores for your AWS resources.”
Today we are simplifying the process of collecting statistics from your system and getting them in to CloudWatch with the introduction of a new CloudWatch plugin for collectd. By combining collectd's ability to gather many different types of statistics with the CloudWatch features for storage, display, alerting, and alarming, you can become better informed about the state and performance of your EC2 instances and your on-premises hardware and the applications running on them. The plugin is being released as an open source project and we are looking forward to your pull requests.
The collectd daemon is written in C for performance and portability. It supports over one hundred plugins, allowing you to collect statistics on Apache and Nginx web server performance, memory usage, uptime, and much more.
Installation and Configuration
I installed and configured collectd and the new plugin on an EC2 instance in order to see it in action.
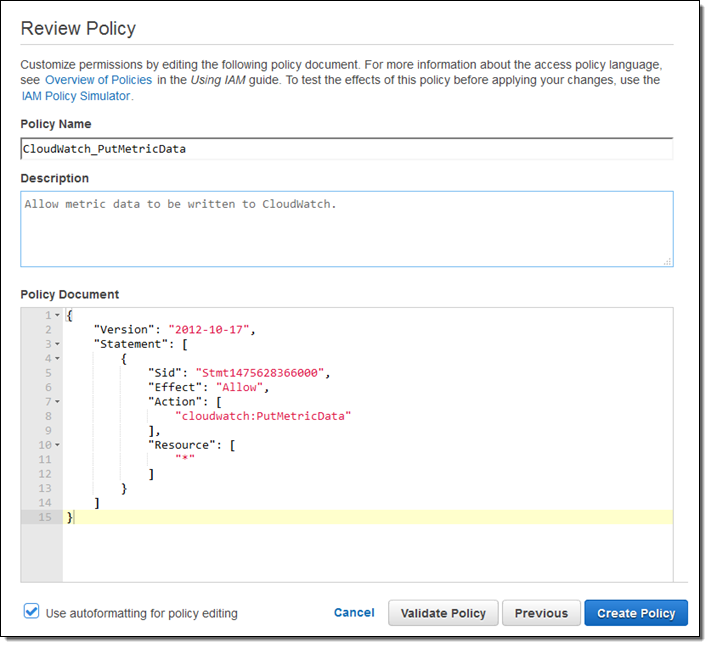
To get started I created an IAM Policy with permission to write metrics data to CloudWatch:

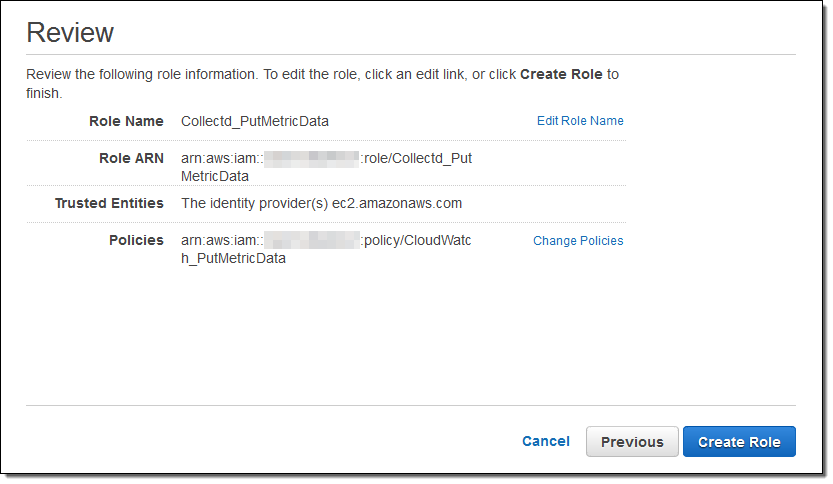
Then I created an IAM Role that allows EC2 (and hence the collectd code running on my instance) to use my Policy:

If I was planning to use the plugin to collect statistics from my on-premises servers or if my EC2 instances were already running, I could have skipped these steps, and created an IAM user with the appropriate permissions instead. Had I done this, I would have had to put the user's credentials on the servers or instances.
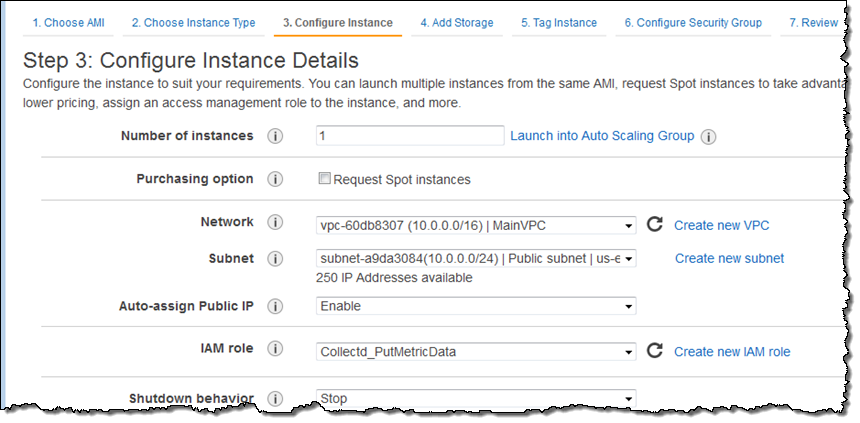
With the Policy and the Role in place, I launched an EC2 instance and selected the Role:

I logged in and installed collectd:
$ sudo yum -y install collectdThen I fetched the plugin and the install script, made the script executable, and ran it:
$ chmod a+x setup.py

$ sudo ./setup.py
I answered a few questions and the setup ran without incident, starting up collectd after configuring it:
Installing dependencies ... OK

Installing python dependencies ... OK

Copying plugin tar file ... OK

Extracting plugin ... OK

Moving to collectd plugins directory ... OK

Copying CloudWatch plugin include file ... OK


Choose AWS region for published metrics:

  1. Automatic [us-east-1]

  2. Custom

Enter choice [1]: 1


Choose hostname for published metrics:

  1. EC2 instance id [i-057d2ed2260c3e251]

  2. Custom

Enter choice [1]: 1


Choose authentication method:

  1. IAM Role [Collectd_PutMetricData]

  2. IAM User

Enter choice [1]: 1


Choose how to install CloudWatch plugin in collectd:

  1. Do not modify existing collectd configuration

  2. Add plugin to the existing configuration

Enter choice [2]: 2

Plugin configuration written successfully.

Stopping collectd process ... NOT OK

Starting collectd process ... OK

$
With collectd running and the plugin installed and configured, the next step was to decide on the statistics of interest and configure the plugin to publish them to CloudWatch (note that there is a per-metric cost so this is an important step).
The file /opt/collectd-plugins/cloudwatch/config/blocked_metrics contains a list of metrics that have been collected but not published to CloudWatch:
$ cat /opt/collectd-plugins/cloudwatch/config/blocked_metrics

# This file is automatically generated - do not modify this file.

# Use this file to find metrics to be added to the whitelist file instead.

cpu-0-cpu-user

cpu-0-cpu-nice

cpu-0-cpu-system

cpu-0-cpu-idle

cpu-0-cpu-wait

cpu-0-cpu-interrupt

cpu-0-cpu-softirq

cpu-0-cpu-steal

interface-lo-if_octets-

interface-lo-if_packets-

interface-lo-if_errors-

interface-eth0-if_octets-

interface-eth0-if_packets-

interface-eth0-if_errors-

memory--memory-used

load--load-

memory--memory-buffered

memory--memory-cached
I was interested in memory consumption so I added one line to /opt/collectd-plugins/cloudwatch/config/whitelist.conf:
memory--memory-.*The collectd configuration file (/etc/collectd.conf) contains additional settings for collectd and the plugins. I did not need to make any changes to it.
I restarted collectd so that it would pick up the change:
$ sudo service collectd restart
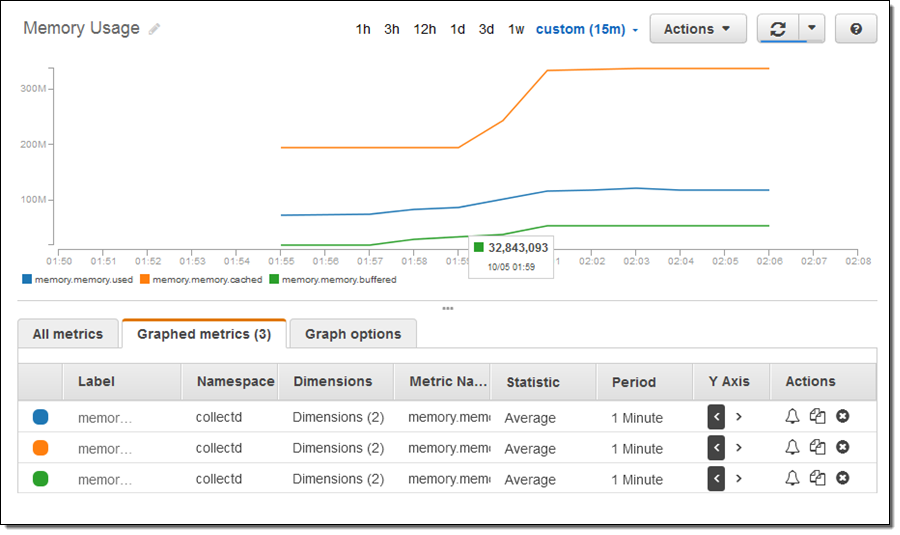
I exercised my instance a bit in order to consume some memory, and then opened up the CloudWatch Console to locate and display my metrics:

This screenshot includes a preview of an upcoming enhancement to the CloudWatch Console; don't worry if yours doesn't look as cool (stay tuned for more information on this).
If I had been monitoring a production instance, I could have installed one or more of the collectd plugins. Here's a list of what's available on the Amazon Linux AMI:
$ sudo yum list | grep collectd

collectd.x86_64                        5.4.1-1.11.amzn1               @amzn-main

collectd-amqp.x86_64                   5.4.1-1.11.amzn1               amzn-main

collectd-apache.x86_64                 5.4.1-1.11.amzn1               amzn-main

collectd-bind.x86_64                   5.4.1-1.11.amzn1               amzn-main

collectd-curl.x86_64                   5.4.1-1.11.amzn1               amzn-main

collectd-curl_xml.x86_64               5.4.1-1.11.amzn1               amzn-main

collectd-dbi.x86_64                    5.4.1-1.11.amzn1               amzn-main

collectd-dns.x86_64                    5.4.1-1.11.amzn1               amzn-main

collectd-email.x86_64                  5.4.1-1.11.amzn1               amzn-main

collectd-generic-jmx.x86_64            5.4.1-1.11.amzn1               amzn-main

collectd-gmond.x86_64                  5.4.1-1.11.amzn1               amzn-main

collectd-ipmi.x86_64                   5.4.1-1.11.amzn1               amzn-main

collectd-iptables.x86_64               5.4.1-1.11.amzn1               amzn-main

collectd-ipvs.x86_64                   5.4.1-1.11.amzn1               amzn-main

collectd-java.x86_64                   5.4.1-1.11.amzn1               amzn-main

collectd-lvm.x86_64                    5.4.1-1.11.amzn1               amzn-main

collectd-memcachec.x86_64              5.4.1-1.11.amzn1               amzn-main

collectd-mysql.x86_64                  5.4.1-1.11.amzn1               amzn-main

collectd-netlink.x86_64                5.4.1-1.11.amzn1               amzn-main

collectd-nginx.x86_64                  5.4.1-1.11.amzn1               amzn-main

collectd-notify_email.x86_64           5.4.1-1.11.amzn1               amzn-main

collectd-postgresql.x86_64             5.4.1-1.11.amzn1               amzn-main

collectd-rrdcached.x86_64              5.4.1-1.11.amzn1               amzn-main

collectd-rrdtool.x86_64                5.4.1-1.11.amzn1               amzn-main

collectd-snmp.x86_64                   5.4.1-1.11.amzn1               amzn-main

collectd-varnish.x86_64                5.4.1-1.11.amzn1               amzn-main

collectd-web.x86_64                    5.4.1-1.11.amzn1               amzn-main
Things to Know
If you are using version 5.5 or newer of collectd, four metrics are now published by default:
- df-root-percent_bytes-used – disk utilization
- memory–percent-used – memory utilization
- swap–percent-used – swap utilization
- cpu–percent-active – cpu utilization
You can remove these from the whitelist.conf file if you don't want them to be published.
The primary repositories for the Amazon Linux AMI, Ubuntu, RHEL, and CentOS currently provide older versions of collectd; please be aware of this change in the default behavior if you install from a custom repo or build from source.
Lots More
There's quite a bit more than I had time to show you. You can install more plugins and then configure whitelist.conf to publish even more metrics to CloudWatch. You can create CloudWatch Alarms, set up Custom Dashboards, and more.
To get started, visit AWS Labs on GitHub and download the CloudWatch plugin for collectd.
-Jeff;


No comments:
Post a Comment